tensorboardX
A module for visualization with tensorboard
-
class
tensorboardX.SummaryWriter(logdir=None, comment='', purge_step=None, max_queue=10, flush_secs=120, filename_suffix='', write_to_disk=True, **kwargs)[source]¶ Writes entries directly to event files in the logdir to be consumed by TensorBoard.
The SummaryWriter class provides a high-level API to create an event file in a given directory and add summaries and events to it. The class updates the file contents asynchronously. This allows a training program to call methods to add data to the file directly from the training loop, without slowing down training.
-
__init__(logdir=None, comment='', purge_step=None, max_queue=10, flush_secs=120, filename_suffix='', write_to_disk=True, **kwargs)[source]¶ Creates a SummaryWriter that will write out events and summaries to the event file.
Parameters: - logdir (string) – Save directory location. Default is runs/CURRENT_DATETIME_HOSTNAME, which changes after each run. Use hierarchical folder structure to compare between runs easily. e.g. pass in ‘runs/exp1’, ‘runs/exp2’, etc. for each new experiment to compare across them.
- comment (string) – Comment logdir suffix appended to the default
logdir. Iflogdiris assigned, this argument has no effect. - purge_step (int) – When logging crashes at step \(T+X\) and restarts at step \(T\),
any events whose global_step larger or equal to \(T\) will be
purged and hidden from TensorBoard.
Note that crashed and resumed experiments should have the same
logdir. - max_queue (int) – Size of the queue for pending events and summaries before one of the ‘add’ calls forces a flush to disk. Default is ten items.
- flush_secs (int) – How often, in seconds, to flush the pending events and summaries to disk. Default is every two minutes.
- filename_suffix (string) – Suffix added to all event filenames in the logdir directory. More details on filename construction in tensorboard.summary.writer.event_file_writer.EventFileWriter.
- write_to_disk (boolean) – If pass False, SummaryWriter will not write to disk.
Examples:
from tensorboardX import SummaryWriter

# create a summary writer with automatically generated folder name.
writer = SummaryWriter()
# folder location: runs/May04_22-14-54_s-MacBook-Pro.local/

# create a summary writer using the specified folder name.
writer = SummaryWriter("my_experiment")
# folder location: my_experiment

# create a summary writer with comment appended.
writer = SummaryWriter(comment="LR_0.1_BATCH_16")
# folder location: runs/May04_22-14-54_s-MacBook-Pro.localLR_0.1_BATCH_16/
-
add_audio(tag, snd_tensor, global_step=None, sample_rate=44100, walltime=None)[source]¶ Add audio data to summary.
Parameters: - tag (string) – Data identifier
- snd_tensor (torch.Tensor) – Sound data
- global_step (int) – Global step value to record
- sample_rate (int) – sample rate in Hz
- walltime (float) – Optional override default walltime (time.time()) of event
- Shape:
- snd_tensor: \((1, L)\). The values should lie between [-1, 1].
-
add_custom_scalars(layout)[source]¶ Create special chart by collecting charts tags in ‘scalars’. Note that this function can only be called once for each SummaryWriter() object. Because it only provides metadata to tensorboard, the function can be called before or after the training loop. See
examples/demo_custom_scalars.pyfor more.Parameters: layout (dict) – {categoryName: charts}, where charts is also a dictionary {chartName: ListOfProperties}. The first element in ListOfProperties is the chart’s type (one of Multiline or Margin) and the second element should be a list containing the tags you have used in add_scalar function, which will be collected into the new chart. Examples:
layout = {'Taiwan':{'twse':['Multiline',['twse/0050', 'twse/2330']]},
             'USA':{ 'dow':['Margin',   ['dow/aaa', 'dow/bbb', 'dow/ccc']],
                  'nasdaq':['Margin',   ['nasdaq/aaa', 'nasdaq/bbb', 'nasdaq/ccc']]}}

writer.add_custom_scalars(layout)
-
add_custom_scalars_marginchart(tags, category='default', title='untitled')[source]¶ Shorthand for creating marginchart. Similar to
add_custom_scalars(), but the only necessary argument is tags, which should have exactly 3 elements.Parameters: tags (list) – list of tags that have been used in add_scalar()Examples:
writer.add_custom_scalars_marginchart(['twse/0050', 'twse/2330', 'twse/2006'])
-
add_custom_scalars_multilinechart(tags, category='default', title='untitled')[source]¶ Shorthand for creating multilinechart. Similar to
add_custom_scalars(), but the only necessary argument is tags.Parameters: tags (list) – list of tags that have been used in add_scalar()Examples:
writer.add_custom_scalars_multilinechart(['twse/0050', 'twse/2330'])
-
add_embedding(mat, metadata=None, label_img=None, global_step=None, tag='default', metadata_header=None)[source]¶ Add embedding projector data to summary.
Parameters: - mat (torch.Tensor or numpy.array) – A matrix which each row is the feature vector of the data point
- metadata (list) – A list of labels, each element will be convert to string
- label_img (torch.Tensor) – Images correspond to each data point
- global_step (int) – Global step value to record
- tag (string) – Name for the embedding
- Shape:
mat: \((N, D)\), where N is number of data and D is feature dimension
label_img: \((N, C, H, W)\)
Examples:
import keyword
import torch
meta = []
while len(meta)<100:
    meta = meta+keyword.kwlist # get some strings
meta = meta[:100]

for i, v in enumerate(meta):
    meta[i] = v+str(i)

label_img = torch.rand(100, 3, 10, 32)
for i in range(100):
    label_img[i]*=i/100.0

writer.add_embedding(torch.randn(100, 5), metadata=meta, label_img=label_img)
writer.add_embedding(torch.randn(100, 5), label_img=label_img)
writer.add_embedding(torch.randn(100, 5), metadata=meta)
-
add_figure(tag, figure, global_step=None, close=True, walltime=None)[source]¶ Render matplotlib figure into an image and add it to summary.
Note that this requires the
matplotlibpackage.Parameters:
-
add_graph(model, input_to_model=None, verbose=False, **kwargs)[source]¶ Add graph data to summary.
Parameters: - model (torch.nn.Module) – Model to draw.
- input_to_model (torch.Tensor or list of torch.Tensor) – A variable or a tuple of variables to be fed.
- verbose (bool) – Whether to print graph structure in console.
- omit_useless_nodes (bool) – Default to
true, which eliminates unused nodes. - operator_export_type (string) – One of:
"ONNX","RAW". This determines the optimization level of the graph. If error happens during exporting the graph, using"RAW"might help.
-
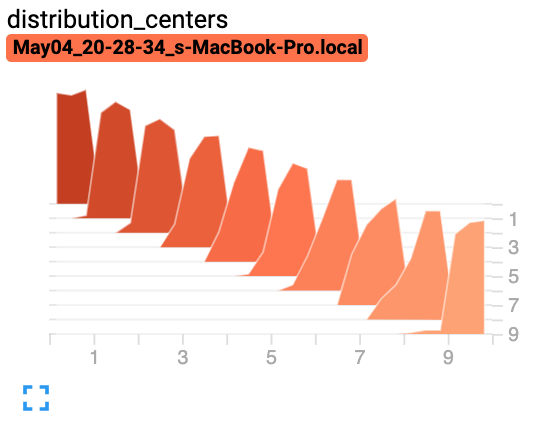
add_histogram(tag, values, global_step=None, bins='tensorflow', walltime=None, max_bins=None)[source]¶ Add histogram to summary.
Parameters: - tag (string) – Data identifier
- values (torch.Tensor, numpy.array, or string/blobname) – Values to build histogram
- global_step (int) – Global step value to record
- bins (string) – One of {‘tensorflow’,’auto’, ‘fd’, …}. This determines how the bins are made. You can find other options in: https://docs.scipy.org/doc/numpy/reference/generated/numpy.histogram.html
- walltime (float) – Optional override default walltime (time.time()) of event
Examples:
from tensorboardX import SummaryWriter
import numpy as np
writer = SummaryWriter()
for i in range(10):
    x = np.random.random(1000)
    writer.add_histogram('distribution centers', x + i, i)
writer.close()
Expected result:
-
add_histogram_raw(tag, min, max, num, sum, sum_squares, bucket_limits, bucket_counts, global_step=None, walltime=None)[source]¶ Adds histogram with raw data.
Parameters: - tag (string) – Data identifier
- min (float or int) – Min value
- max (float or int) – Max value
- num (int) – Number of values
- sum (float or int) – Sum of all values
- sum_squares (float or int) – Sum of squares for all values
- bucket_limits (torch.Tensor, numpy.array) – Upper value per bucket, note that the bucket_limits returned from np.histogram has one more element. See the comment in the following example.
- bucket_counts (torch.Tensor, numpy.array) – Number of values per bucket
- global_step (int) – Global step value to record
- walltime (float) – Optional override default walltime (time.time()) of event
Examples:
import numpy as np
dummy_data = []
for idx, value in enumerate(range(30)):
    dummy_data += [idx + 0.001] * value
values = np.array(dummy_data).astype(float).reshape(-1)
counts, limits = np.histogram(values)
sum_sq = values.dot(values)
with SummaryWriter() as summary_writer:
    summary_writer.add_histogram_raw(
            tag='hist_dummy_data',
            min=values.min(),
            max=values.max(),
            num=len(values),
            sum=values.sum(),
            sum_squares=sum_sq,
            bucket_limits=limits[1:].tolist(),  # <- note here.
            bucket_counts=counts.tolist(),
            global_step=0)
-
add_image(tag, img_tensor, global_step=None, walltime=None, dataformats='CHW')[source]¶ Add image data to summary.
Note that this requires the
pillowpackage.Parameters: - tag (string) – Data identifier
- img_tensor (torch.Tensor, numpy.array, or string/blobname) – Image data
- global_step (int) – Global step value to record
- walltime (float) – Optional override default walltime (time.time()) of event
- Shape:
- img_tensor: Default is \((3, H, W)\). You can use
torchvision.utils.make_grid()to convert a batch of tensor into 3xHxW format or calladd_imagesand let us do the job. Tensor with \((1, H, W)\), \((H, W)\), \((H, W, 3)\) is also suitible as long as correspondingdataformatsargument is passed. e.g. CHW, HWC, HW.
Examples:
from tensorboardX import SummaryWriter
import numpy as np
img = np.zeros((3, 100, 100))
img[0] = np.arange(0, 10000).reshape(100, 100) / 10000
img[1] = 1 - np.arange(0, 10000).reshape(100, 100) / 10000

img_HWC = np.zeros((100, 100, 3))
img_HWC[:, :, 0] = np.arange(0, 10000).reshape(100, 100) / 10000
img_HWC[:, :, 1] = 1 - np.arange(0, 10000).reshape(100, 100) / 10000

writer = SummaryWriter()
writer.add_image('my_image', img, 0)

# If you have non-default dimension setting, set the dataformats argument.
writer.add_image('my_image_HWC', img_HWC, 0, dataformats='HWC')
writer.close()
Expected result:

-
add_image_with_boxes(tag, img_tensor, box_tensor, global_step=None, walltime=None, dataformats='CHW', **kwargs)[source]¶ Add image and draw bounding boxes on the image.
Parameters: - tag (string) – Data identifier
- img_tensor (torch.Tensor, numpy.array, or string/blobname) – Image data
- box_tensor (torch.Tensor, numpy.array, or string/blobname) – Box data (for detected objects)
- global_step (int) – Global step value to record
- walltime (float) – Optional override default walltime (time.time()) of event
- Shape:
img_tensor: Default is \((3, H, W)\). It can be specified with
dataformatagrument. e.g. CHW or HWCbox_tensor: (torch.Tensor, numpy.array, or string/blobname): NX4, where N is the number of boxes and each 4 elememts in a row represents (xmin, ymin, xmax, ymax).
-
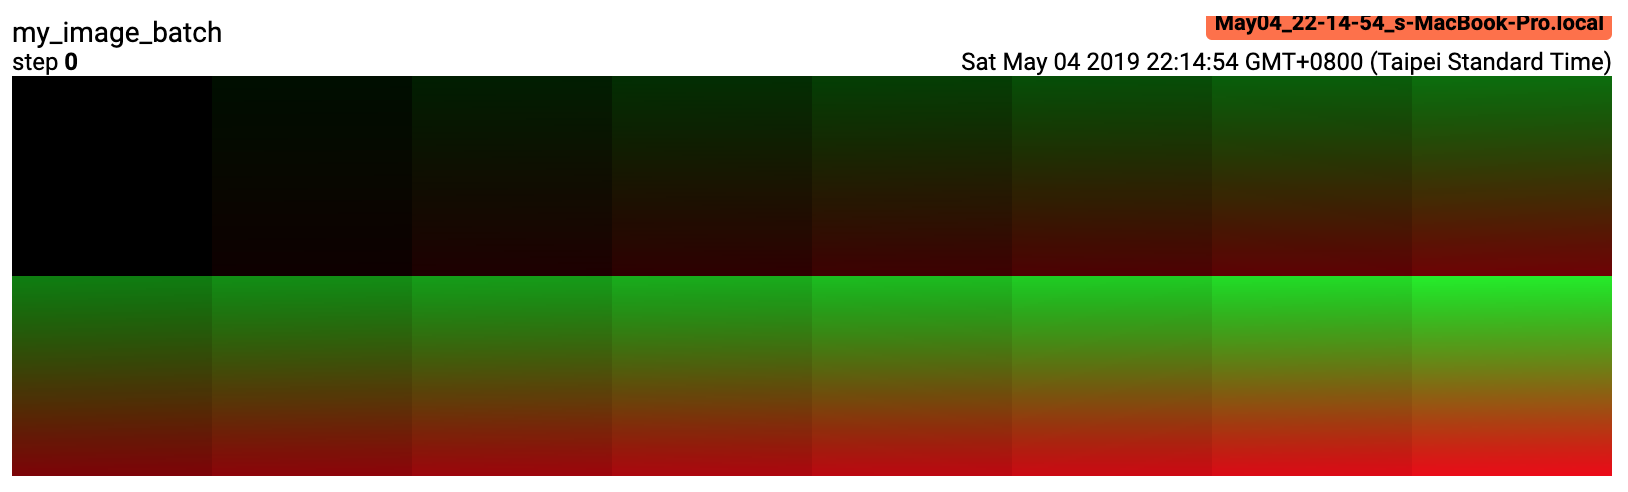
add_images(tag, img_tensor, global_step=None, walltime=None, dataformats='NCHW')[source]¶ Add batched image data to summary.
Note that this requires the
pillowpackage.Parameters: - tag (string) – Data identifier
- img_tensor (torch.Tensor, numpy.array, or string/blobname) – Image data
- global_step (int) – Global step value to record
- walltime (float) – Optional override default walltime (time.time()) of event
- Shape:
- img_tensor: Default is \((N, 3, H, W)\). If
dataformatsis specified, other shape will be accepted. e.g. NCHW or NHWC.
Examples:
from tensorboardX import SummaryWriter
import numpy as np

img_batch = np.zeros((16, 3, 100, 100))
for i in range(16):
    img_batch[i, 0] = np.arange(0, 10000).reshape(100, 100) / 10000 / 16 * i
    img_batch[i, 1] = (1 - np.arange(0, 10000).reshape(100, 100) / 10000) / 16 * i

writer = SummaryWriter()
writer.add_images('my_image_batch', img_batch, 0)
writer.close()
Expected result:
-
add_pr_curve(tag, labels, predictions, global_step=None, num_thresholds=127, weights=None, walltime=None)[source]¶ Adds precision recall curve. Plotting a precision-recall curve lets you understand your model’s performance under different threshold settings. With this function, you provide the ground truth labeling (T/F) and prediction confidence (usually the output of your model) for each target. The TensorBoard UI will let you choose the threshold interactively.
Parameters: - tag (string) – Data identifier
- labels (torch.Tensor, numpy.array, or string/blobname) – Ground truth data. Binary label for each element.
- predictions (torch.Tensor, numpy.array, or string/blobname) – The probability that an element be classified as true. Value should in [0, 1]
- global_step (int) – Global step value to record
- num_thresholds (int) – Number of thresholds used to draw the curve.
- walltime (float) – Optional override default walltime (time.time()) of event
Examples:
from tensorboardX import SummaryWriter
import numpy as np
labels = np.random.randint(2, size=100)  # binary label
predictions = np.random.rand(100)
writer = SummaryWriter()
writer.add_pr_curve('pr_curve', labels, predictions, 0)
writer.close()
-
add_pr_curve_raw(tag, true_positive_counts, false_positive_counts, true_negative_counts, false_negative_counts, precision, recall, global_step=None, num_thresholds=127, weights=None, walltime=None)[source]¶ Adds precision recall curve with raw data.
Parameters: - tag (string) – Data identifier
- true_positive_counts (torch.Tensor, numpy.array, or string/blobname) – true positive counts
- false_positive_counts (torch.Tensor, numpy.array, or string/blobname) – false positive counts
- true_negative_counts (torch.Tensor, numpy.array, or string/blobname) – true negative counts
- false_negative_counts (torch.Tensor, numpy.array, or string/blobname) – false negative counts
- precision (torch.Tensor, numpy.array, or string/blobname) – precision
- recall (torch.Tensor, numpy.array, or string/blobname) – recall
- global_step (int) – Global step value to record
- num_thresholds (int) – Number of thresholds used to draw the curve.
- walltime (float) – Optional override default walltime (time.time()) of event
- see – https://github.com/tensorflow/tensorboard/blob/master/tensorboard/plugins/pr_curve/README.md
-
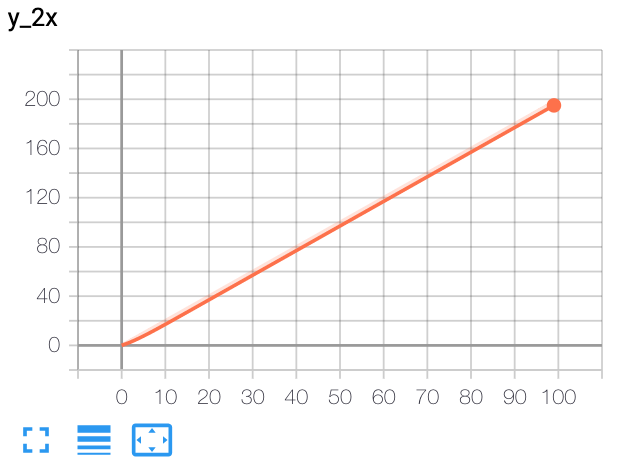
add_scalar(tag, scalar_value, global_step=None, walltime=None)[source]¶ Add scalar data to summary.
Parameters: Examples:
from tensorboardX import SummaryWriter
writer = SummaryWriter()
x = range(100)
for i in x:
    writer.add_scalar('y=2x', i * 2, i)
writer.close()
Expected result:
-
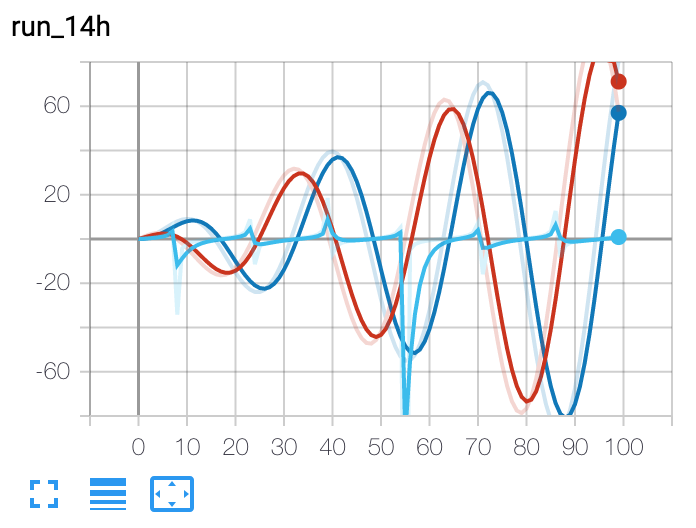
add_scalars(main_tag, tag_scalar_dict, global_step=None, walltime=None)[source]¶ Adds many scalar data to summary.
Note that this function also keeps logged scalars in memory. In extreme case it explodes your RAM.
Parameters: Examples:
from tensorboardX import SummaryWriter
writer = SummaryWriter()
r = 5
for i in range(100):
    writer.add_scalars('run_14h', {'xsinx':i*np.sin(i/r),
                                    'xcosx':i*np.cos(i/r),
                                    'tanx': np.tan(i/r)}, i)
writer.close()
# This call adds three values to the same scalar plot with the tag
# 'run_14h' in TensorBoard's scalar section.
Expected result:
-
add_text(tag, text_string, global_step=None, walltime=None)[source]¶ Add text data to summary.
Parameters: Examples:
writer.add_text('lstm', 'This is an lstm', 0)
writer.add_text('rnn', 'This is an rnn', 10)
-
add_video(tag, vid_tensor, global_step=None, fps=4, walltime=None)[source]¶ Add video data to summary.
Note that this requires the
moviepypackage.Parameters: - tag (string) – Data identifier
- vid_tensor (torch.Tensor) – Video data
- global_step (int) – Global step value to record
- fps (float or int) – Frames per second
- walltime (float) – Optional override default walltime (time.time()) of event
- Shape:
- vid_tensor: \((N, T, C, H, W)\). The values should lie in [0, 255] for type uint8 or [0, 1] for type float.
-
-
class
tensorboardX.TorchVis(*args, **init_kwargs)[source]¶ -
__init__(*args, **init_kwargs)[source]¶ Parameters: - args (list of strings) – The name of the visualization target(s). Accepted targets are ‘tensorboard’ and ‘visdom’.
- init_kwargs – Additional keyword parameters for the visdom writer (For example, server IP). See https://github.com/facebookresearch/visdom/blob/master/README.md#visdom-arguments-python-only for more.
-